Some things in life are better left a mystery. I personally don’t want to know how an airplane works, why puppies are cute or what’s in the tub of tuna salad at the deli. I both fear the truth and don’t want to spoil the wonder of it all. I feel the same way toward sex stuff — it feels good, and therefore, I have no further questions.
It is possible, though, that if I knew more about it, knowledge could be power. If only I had the data to pinpoint the how and why my pleasure worked, sex could feel even better. At least that’s the argument made on TikTok by Anna Lee, co-founder and engineer of Lioness sex toys, as she catalogues her orgasms for an audience of millions.
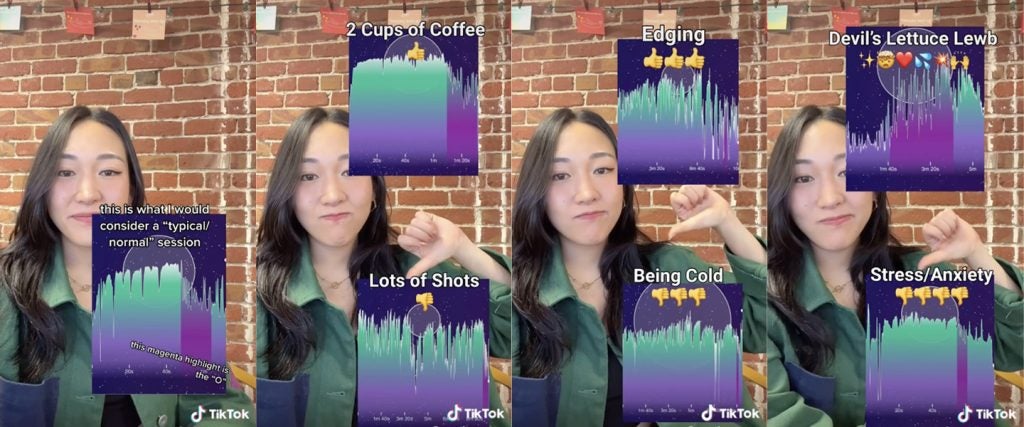
Rather than simply providing sex and masturbation advice, Lee’s TikToks are supported by colorful graphs that represent her jerk-off data. In a recent video with 575,000 views titled “My Best and Worst ‘Os’ of 2021,” Lee shows how her graphs compare under various circumstances. One chart, “Two Cups of Coffee,” shows a thick purple portion, while another, “Lots of Shots,” is mostly turquoise. Another graph, “Stress and Anxiety,” features a few peaks and little purple, while “Devil’s Lettuce Lewb” is rollercoaster-shaped and contains the most purple of all.
As she explains in her video, the purple represents an orgasm — the more purple, the longer the orgasm. The turquoise represents the rest of the masturbation session, and the spikes represent pelvic contractions, which occur involuntarily during orgasm. All of these charts were created using a Lioness vibrator that tracks such contractions when inserted vaginally (though it has a clit stimulator on it, too).
Basically, by tracking contractions and presenting them in digestible charts via the Lioness app, users can get a better grasp of the quality of their orgasms and what variables make them stronger and longer. The vibrator has some other neat features — like 100 customizable strengths — but at $230, you’ve gotta be into the whole data component for it to make sense. “I’m a huge lover of data and self-tracking devices so I’m somewhat biased, but I’d give it 4.5/5,” a redditor wrote on r/SexToys. “It’s a little surprising to me that there aren’t other companies attempting this honestly.”
But even without the Lioness, there’s tons to glean from Lee’s TikToks. In her most popular video, with 17.5 million views, she tracked her orgasm while she used a showerhead and the Lioness at the same time. While everyone’s different, the length of the purple segment on the resulting graph is as good an endorsement as any that the showerhead is effective. Lee also shares insights into other research, like how some studies have found that the majority of heterosexual women who orgasm during sex require 30- to 60-minute-long sex sessions to do so.
Lioness is currently the only “smart” vibrator that offers this style of data-tracking, but it’s certainly not the only way you can track your masturbation habits. It’s totally possible to do some of this data tracking on your own, albeit somewhat less scientifically. As my editor Isabelle Kohn wrote last year, some people were keeping spreadsheets of their masturbation habits that they later turned into graphs and charts during quarantine. Rather than using biofeedback like Lioness, they simply tracked factors like the duration of the session or how many times they masturbated on a given day. In that case, it was out of quarantine boredom, but it’s easy to see how you could track the same variables Lioness users can on your own.
I personally have little interest in tracking the data of my own orgasms — that’s between my body and God — but I do feel like I’ve learned a bit just from seeing the data of someone else’s (like that weed lube probably rules, that getting a concussion can completely change your orgasms and that coffee can increase the intensity of an orgasm by 50 percent). And hey, according to those charts Lee makes, orgasms still look pretty fun even when you know all the logistics of what’s happening inside you.
Maybe it doesn’t need to remain a mystery, after all.

Magdalene Taylor
Magdalene Taylor is a staff writer at MEL. She covers internet culture, sex and the online adult industry. She lives in Brooklyn but is from God's Country, Western Massachusetts.